
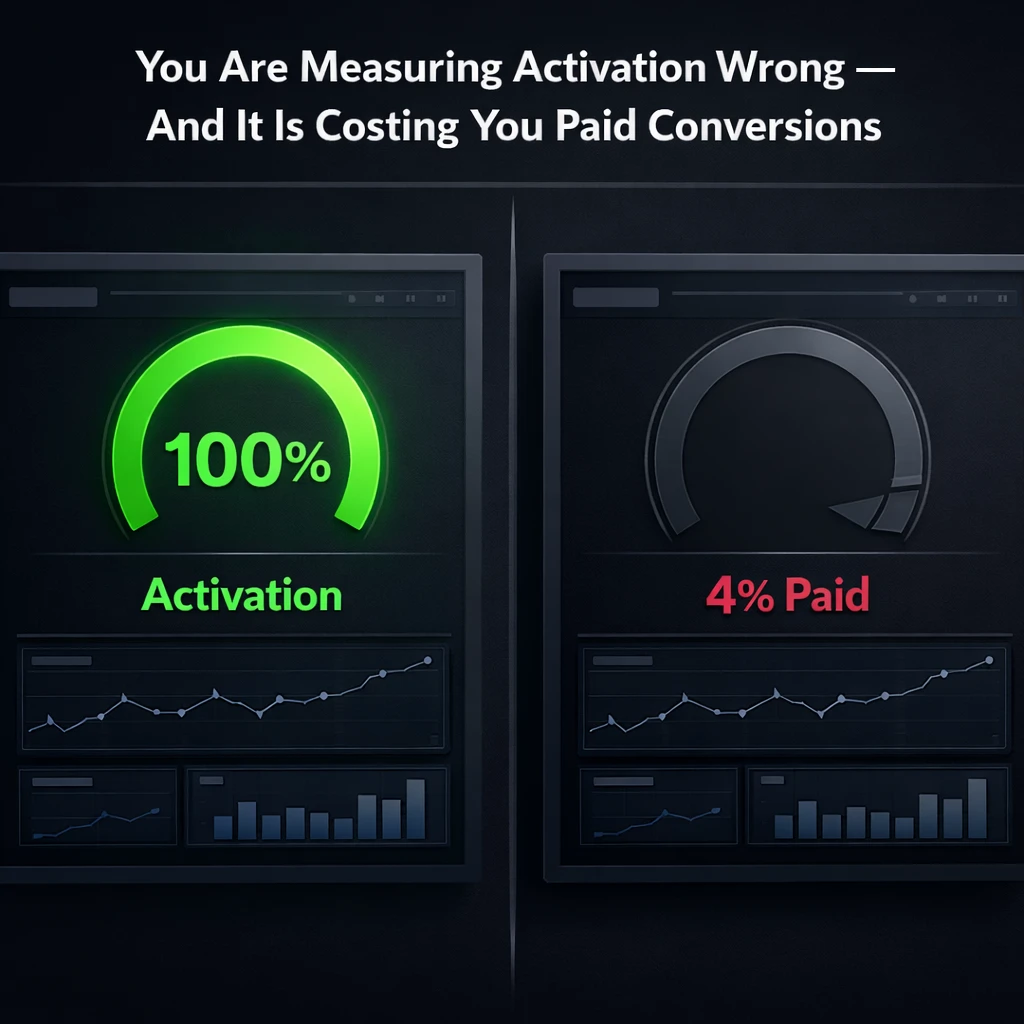


Activation metrics that measure task completion rather than value realization lead to misleading conversion data. A B2B SaaS company showed 100% activation yet only 4% converted because users completed setup steps without experiencing the core benefit.
ChartMogul’s 2026 report found a 10x conversion gap between top and bottom self-serve products, driven by this metric distinction. Redefining activation as a single action tied to long-term retention and willingness to pay can close the leak.
Last week during a SaaSrise CEO mastermind, a B2B SaaS company shared a number that should make every product team uncomfortable. Their free trial users had nearly 100 percent activation. Users signed up, logged in, completed the setup steps, and clicked through the onboarding checklist. It looked perfect on the dashboard. Then only 4 percent converted to paid.
The room offered the usual advice. Add a credit card requirement. Personalize onboarding. Track frequency in the first seven days. All reasonable. All tactical. All missing the real problem.
The real problem is that their activation metric measured whether users completed tasks, not whether users experienced value. Logging in is not activation. Uploading data is not activation. Clicking through a checklist is not activation. Activation is the moment a user experiences the core benefit of your product strongly enough that they would feel its absence if you took it away. Everything before that moment is setup. If your dashboard counts setup steps as activation, your conversion data is lying to you before you even look at the paid numbers.
ChartMogul released its 2026 Conversion Report last week based on data from 200 B2B software products. The median free-to-paid conversion rate across all products is 8 percent. But the distribution is not smooth. There is a 10x gap between the top 20 percent and the bottom 20 percent of self-serve products. That gap is not explained by pricing strategy. It is not explained by market segment. It is explained by whether the product team understands the difference between a user who is busy and a user who is bought in.
The report also surfaces a new cost driver that makes this problem urgent. Supporting free users has gotten significantly more expensive as AI token costs remain high. Every free trial user who activates in the dashboard but never reaches value is burning infrastructure cost, API calls, and compute. You are paying for their confusion. And because the activation metric says everything is fine, nobody sounds the alarm until the conversion report comes back at 4 percent and the CFO starts asking questions.
The fix is not a better onboarding email sequence. It is redefining the activation event itself. The activation metric should be a single action that correlates directly with long-term retention and willingness to pay. For a project management product, it is not creating the first project. It is having three team members collaborate inside that project within 48 hours. For an analytics product, it is not connecting a data source. It is viewing a report that contains insights the user did not already have. For a CRM, it is not importing contacts. It is sending an outreach that gets a reply.
Finding this event requires product audits that go deeper than analytics dashboards. Most analytics tools will tell you what users click. They will not tell you whether the click produced a result the user cares about. That distinction requires watching session recordings, reading support tickets, interviewing users who churned, and mapping the gap between what the product counts as success and what the user counts as success.
One action you can take this week: pull your current activation metric and ask whether it measures task completion or value realization. If a user could hit your activation event and still not be able to explain what your product does for them in a sentence, you are measuring the wrong thing. Redefine the event. Then track whether users who hit the new definition convert at a higher rate than users who only reach the old one. The delta is the size of the product leak you have been ignoring.
At Poplab, we run design audits that identify exactly this kind of product leak — the gap between what your dashboard celebrates and what actually drives revenue. The 4 percent conversion company from last week does not have a marketing problem. It has a product problem dressed in a metric that looks healthy. Fix the metric first. The conversion will follow.

Leave a Reply